From Chaos to Clarity: Adding DataHub to your Streaming Data Platform

You've got to generate a report TODAY. The sales director has a new client presentation tomorrow, and they have to have evidence that your product is saving similar clients money. You scan the datasets you have access to, and nothing fits. That’s fine. You've got a good data platform. You go back to the raw data, write a couple of transforms, join a couple of tables, and voila! You've got the information you need. You put together the report and go home after a long but successful day.
The following morning you put the work you did into production. You know you'll need that data again. A month later, after a few more reports, you get a call: “How does your table differ from marketing’s and research’s?”. Turns out the numbers generated in the reports for sales are not matching up with the numbers generated by marketing, and the CEO wants to know why.
Had you known those tables existed, you probably would’ve just used one. But you didn’t—and now you’ve got a mess.
That's where a lot of data teams are, and where the simple, maintainable system we've built so far ends up if we don't provide some basic governance capabilities.
The Platform So Far
As always core idea is to build value quickly, solve actual problems, learn, and iterate. We could have taken the approach of building the entire stack at once, but I've been down that road, and there is much sadness at the end.
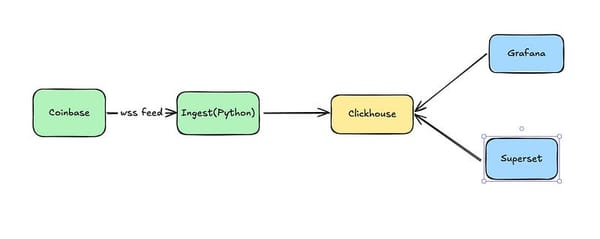
How did we get here? We started by getting data in front of the people who need it using a custom tool for ingestion, ClickHouse for our storage and compute, Superset for BI, and Grafana for observability. I know that last one is a slightly unusual choice, but I talk about it in the 'Simple' post.
That gave a basic, working, platform and gives us streaming data. Putting the pieces together in dev, including the custom code, only took a couple of days.
We then addressed an issue where the data team would not be able to effectively manage the datasets in our platform as we scaled in the Maintainable article.
The problem with the platform so far is that as it gets adoption we'll pretty quickly find ourselves in a place where analysts can't find which dataset they need to build a dashboard, we recreate datasets because we don't know that one already exists, we struggle to identify whether, and where, we have sensitive information, and we have analyses showing numbers that don't match up because we used slightly different datasets unintentionally.
Here we'll layer on DataHub, giving us a nearly complete, albeit still very barebones, platform. DataHub provides an open core metadata platform that gives us the ability to categorize our data, create a data catalog, explore lineage, and set permissioning. Those capabilities are implemented around an open metadata model giving us the ability to extend core functionality and integrate other tools as needed.
Datahub also offers a cloud solution with quite a bit more capability than the open source offering. So far though, we've managed to build a capable data platform entirely on open source, self-hosted tools and we'll continue that here.
DataHub Setup
We'll start by getting DataHub set up and integrating with ClickHouse.
We're just going to use the quickstart approach to installing DataHub. This will get us up and running without much effort on a single node using some non-secure defaults. For a production configuration, DataHub maintains Helm charts which allow us to deploy on Kubernetes and gives us the ability to set up a deployment that is secure and resilient. It also adds a bit of work and limited value for a demo environment.
To install it is just
poetry add acryl-datahub
poetry add acryl-datahub-actions
poetry run datahub docker quickstart
The first two commands are necessary for ingestions to work properly.
After that, grab a cup of coffee. It'll take a minute the first time you run this one. When you are done, you should see something like this:
Starting up DataHub...
[+] Running 13/13
 ✔ Network datahub_network                     Created                                                                                                                                                                  0.0s
 ✔ Container datahub-elasticsearch-1           Healthy                                                                                                                                                                  7.4s
 ✔ Container datahub-mysql-1                   Healthy                                                                                                                                                                  7.4s
 ✔ Container datahub-zookeeper-1               Healthy                                                                                                                                                                  7.4s
 ✔ Container datahub-elasticsearch-setup-1     Exited                                                                                                                                                                  18.9s
 ✔ Container datahub-broker-1                  Healthy                                                                                                                                                                 13.3s
 ✔ Container datahub-mysql-setup-1             Exited                                                                                                                                                                  18.9s
 ✔ Container datahub-schema-registry-1         Healthy                                                                                                                                                                 18.1s
 ✔ Container datahub-kafka-setup-1             Exited                                                                                                                                                                  18.5s
 ✔ Container datahub-datahub-upgrade-1         Exited                                                                                                                                                                  31.4s
 ✔ Container datahub-datahub-gms-1             Healthy                                                                                                                                                                 46.8s
 ✔ Container datahub-datahub-frontend-react-1  Started                                                                                                                                                                 46.6s
 ✔ Container datahub-datahub-actions-1         Started                                                                                                                                                                 46.6s
...
✔ DataHub is now running
Ingest some demo data using `datahub docker ingest-sample-data`,
or head to http://localhost:9002 (username: datahub, password: datahub) to play around with the frontend.
Need support? Get in touch on Slack: https://slack.datahubproject.io/
With that done, we can start populating our datahub instance. DataHub offers integrations with many common data platform components, including Clickhouse.
Go to the 'Ingestion' button in the upper right-hand corner of your screen:

From there, click on 'Create new source' and 'Clickhouse'. That will allow you to edit a YAML file and set the values you need. If you've followed along with the rest, these values should work:
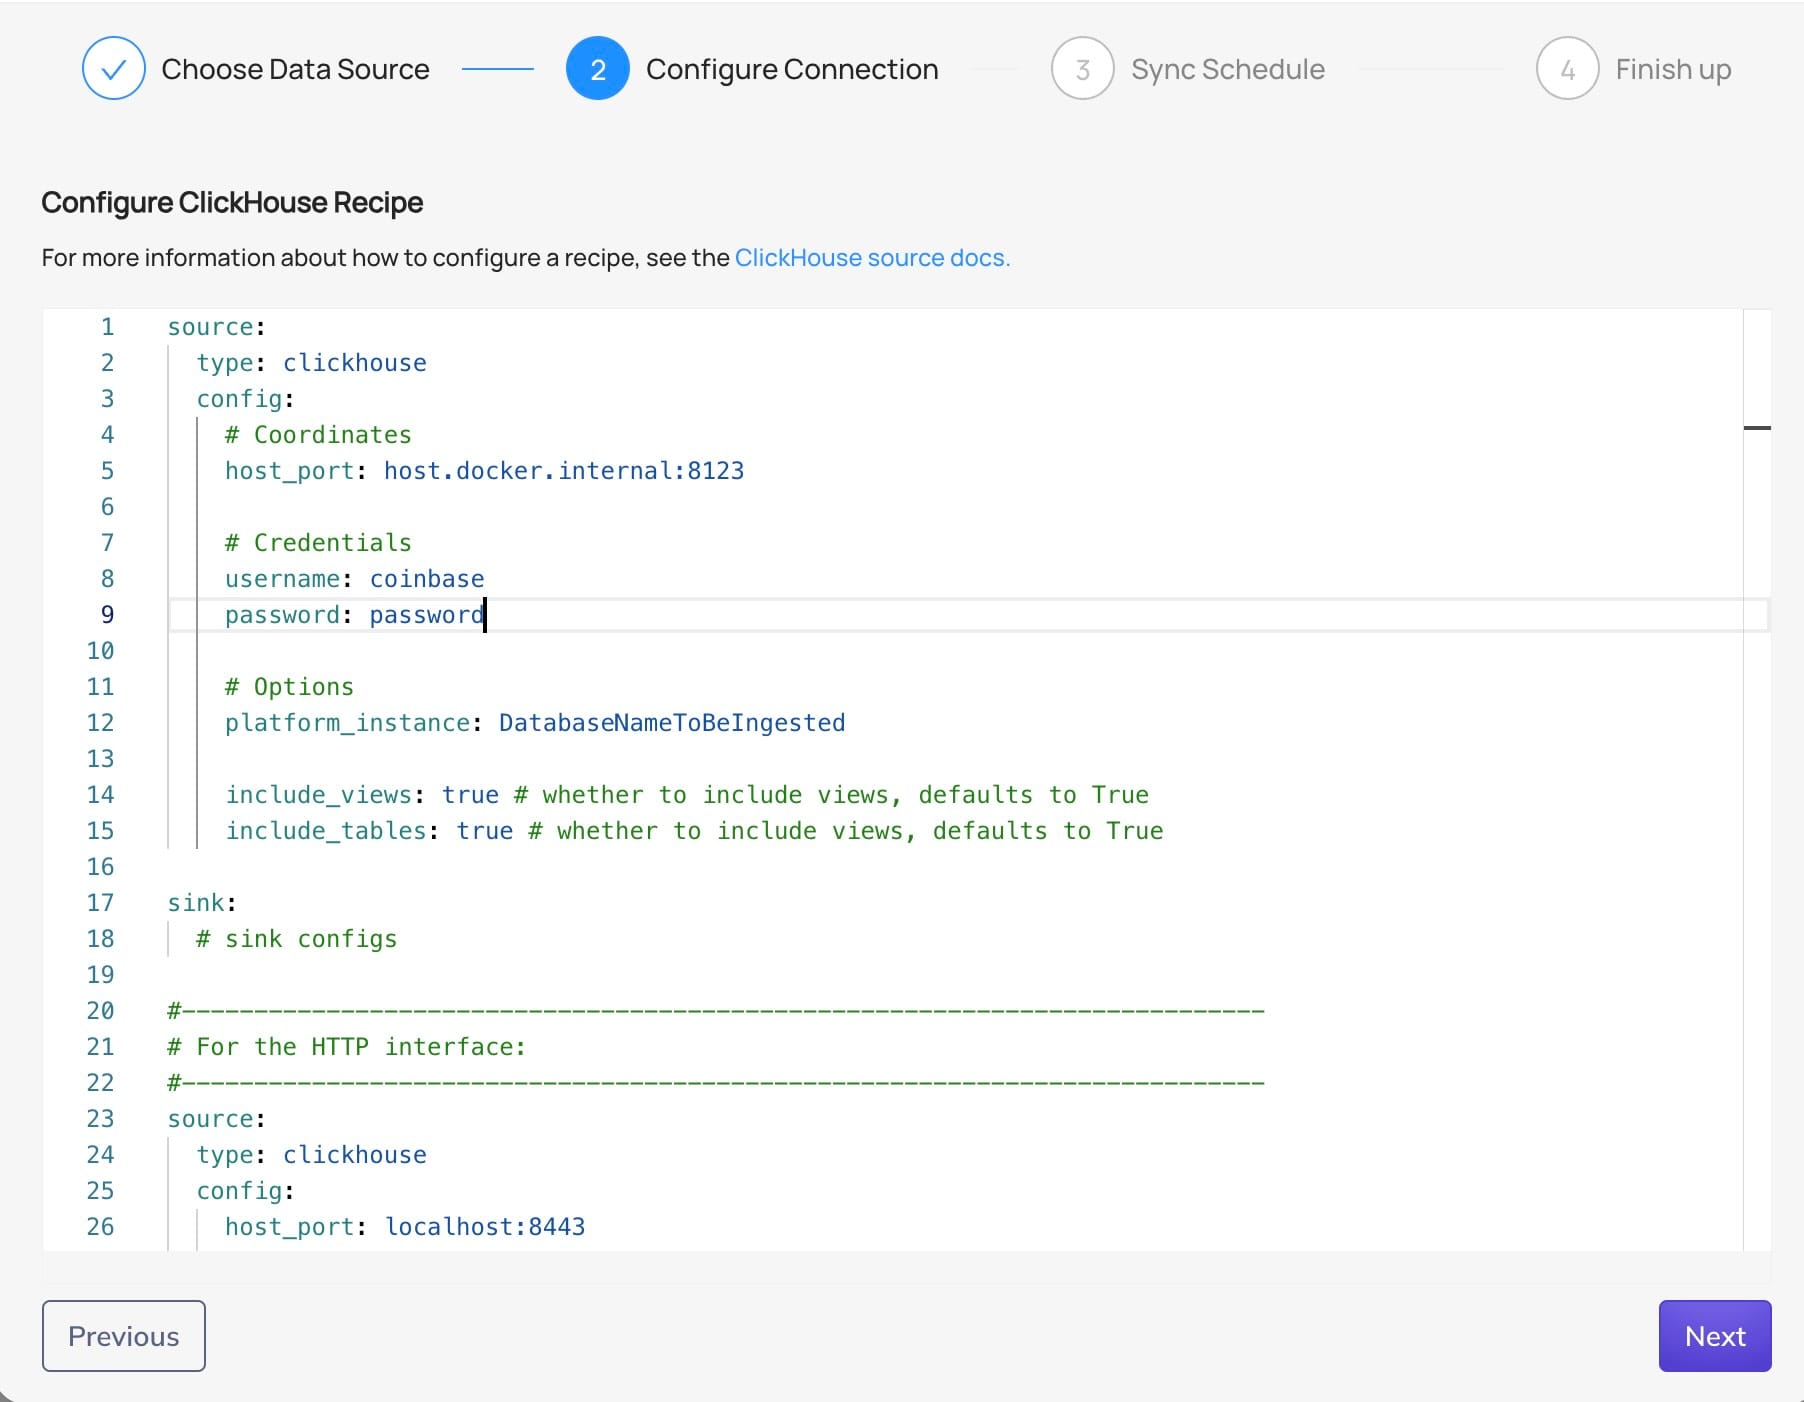
Notice the host and port:
host.docker.internal:8123
Since ClickHouse and DataHub are running in separate Docker containers, they each have their own isolated network environment. Inside a container, localhost refers to the container itself, not your physical machine. To allow DataHub to connect to ClickHouse running on your machine (or vice versa), we use host.docker.internal, which tells the container to route traffic to the host machine’s network.
With that configuration set, you can click through the rest of the menu. Datahub will run your new ingestion, and you will see the following:
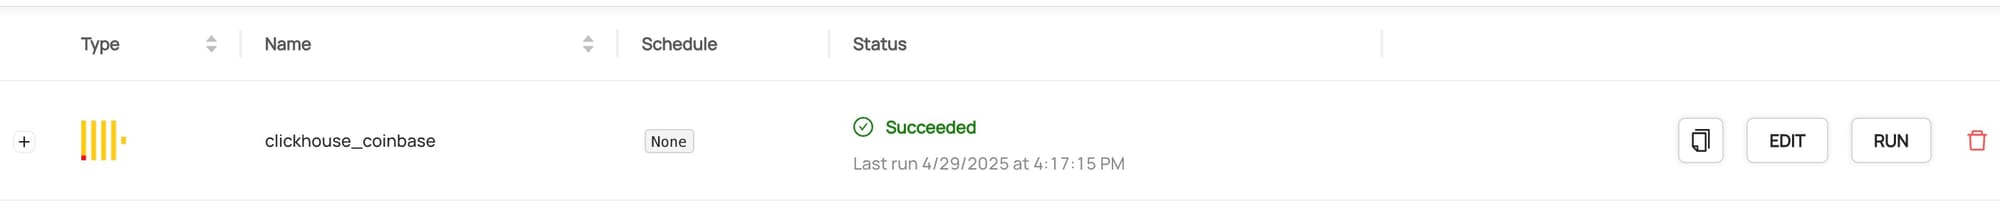
Success! We now have Datahub integrated with Clickhouse.
So What?
Now that we've successfully set up DataHub and integrated it with ClickHouse, let's explore how this solves those real governance challenges we described at the beginning. Remember our hero analyst frantically creating duplicate datasets and inconsistent metrics? DataHub provides capabilities to prevent those scenarios.
Data Discovery and Documentation
The first problem our hero had was that they could not find the existing datasets that met their need. Now that we've ingested metadata from ClickHouse, click in the search bar at the top of the page. Enter a search term, say 'trades', and select datasets.
You'll get back something like this:
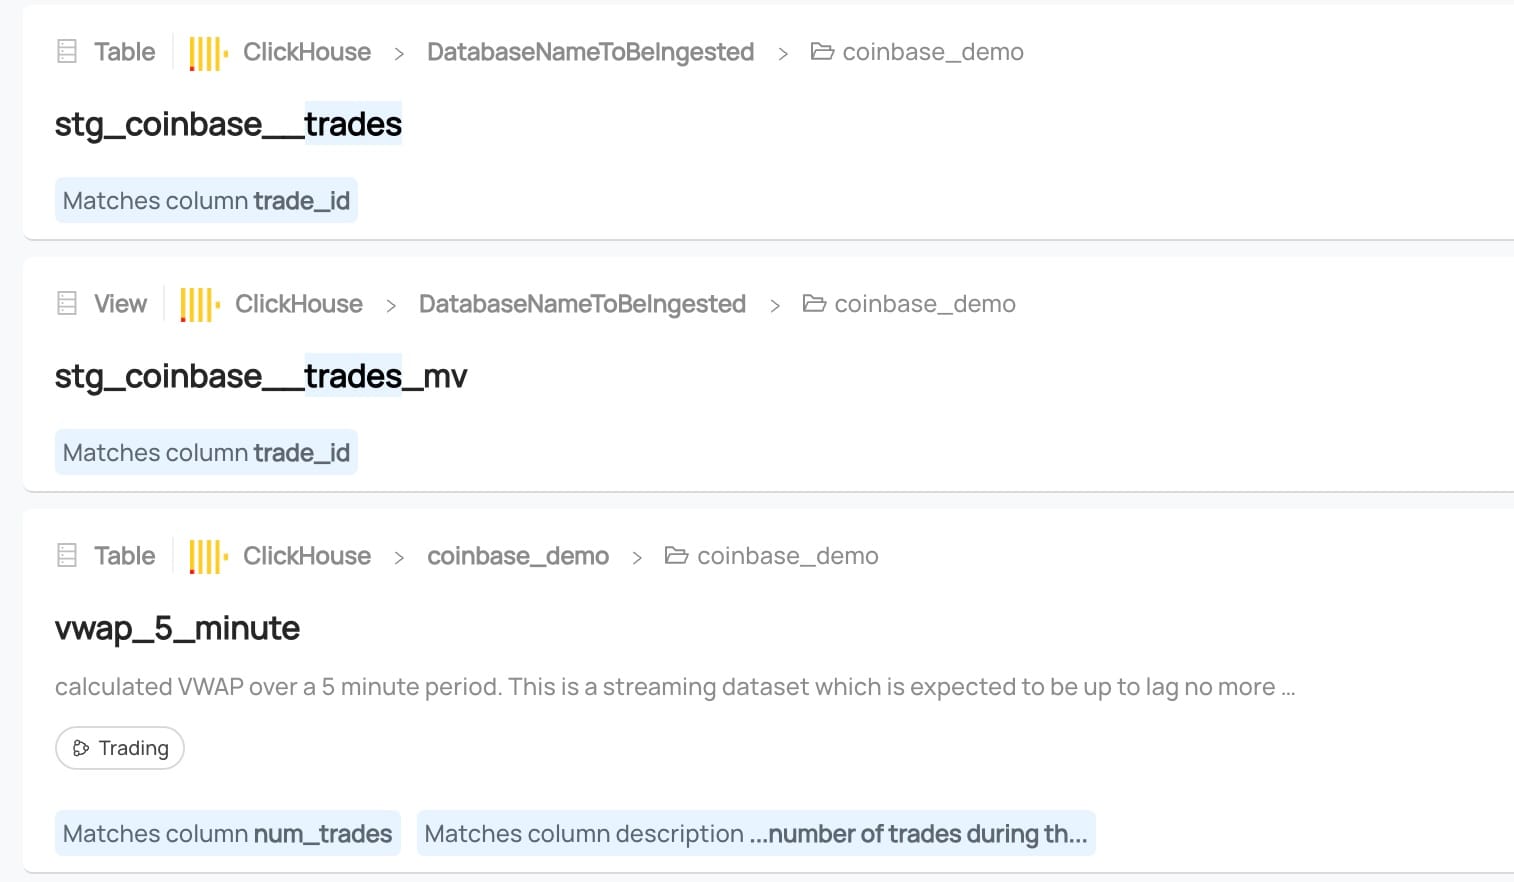
I've already added some metadata to this dataset manually, so you can see the power of this tooling - Not only do we find tables referencing trades, we find the column names, and even descriptions.
You can already see that search is much more powerful when datasets are documented, so let's see how to do that.
Start by selecting one of the datasets in our list. We can start with the 'vwap_5_minute' table. From there, click on the 'minute' column. You'll get the option to add a description for each column. After adding descriptions, it will look something like this:
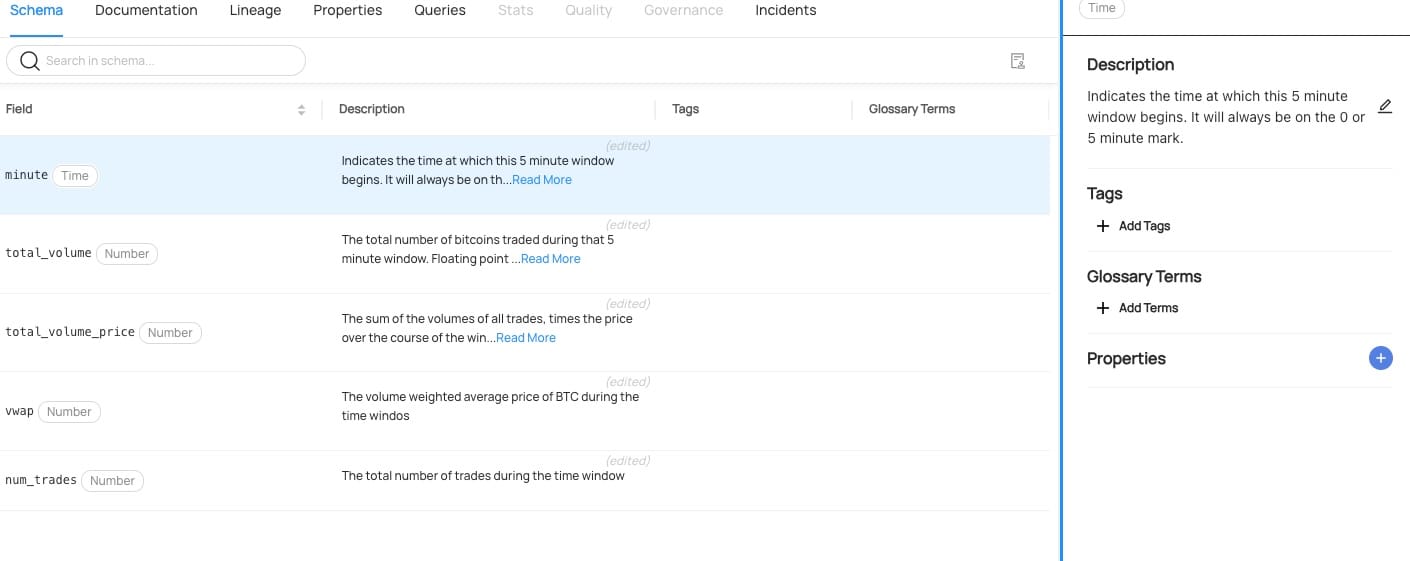
With that done, the next time someone needs to generate a report they have the ability to search and understand the contents of the columns in the datasets they find.
I'm sure our hero analyst is feeling a little better now, but it sure would have been nice if they'd had that capability before.
Data Lineage
Of course, this doesn't fully resolve the problems. Remember that question - how does your table differ from marketing's? That question is still going to come up even if we very intentionally built a new table. We're going to find problems in upstream datasets and want to understand their impacts, and of course, we are going to want to make changes and know what we are impacting.
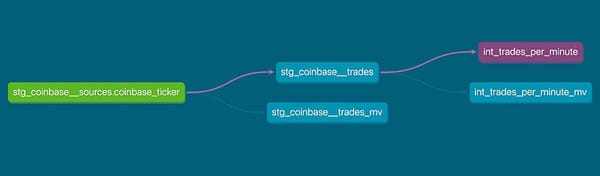
Since we're already looking at the VWAP 5-minute dataset, let's just click on 'Lineage' on the menu under the table name and then 'visualize lineage'. From there, toggle 'Show columns' and start clicking the '+' to the left of datasets.
We can enhance the lineage with information from DBT by first adding the DBT module to our project:
poetry add 'acryl-datahub[dbt]'
Defining a DBT ingestion config for DataHub:
source:
  type: "dbt"
  config:
    manifest_path: "./analytics/target/manifest.json"
    catalog_path: "./analytics/target/catalog.json"
    run_results_path: "./analytics/target/run_results.json"
    target_platform: "clickhouse"
and finally running the ingestion config on the command line:
poetry run datahub ingest -c datahub/dbt_ingest_config.yaml
If you want to see exactly the config I used, you can find both the DBT and clickhouse ingestion configs in the 'datahub' directory of the demo project repo. While I've been showing configuration and usage from the UI, Datahub does have strong command line tooling as well as RBAC capabilities, giving the ability to manage your Datahub installation by checking configs into source control and running commands in your CI/CD pipelines, which I'd highly recommend in a production setup.
Now, the next time someone needs to understand the difference between tables, there's no need to query for the creator of a table and then pull our hero into a meeting - we can look at the lineage, documentation, and find out what is going on.
Data Ownership and Accountability
About that last bit, though - how do we know who to call for questions about a dataset?
Datahub provides a capability to track ownership of datasets. We could just assign individual users, but instead, let's create some groups and use those. After all, people do go on vacation or quit.
Click the gear icon at the upper right of the screen, then select 'Users & Groups' from the left menu. Now select 'Create group' and you should get something like this:
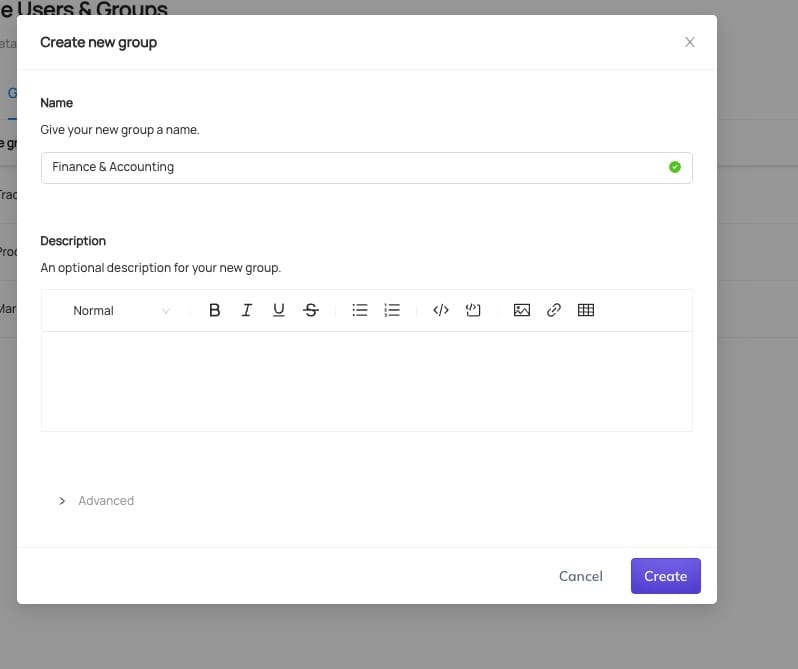
Give your group a name and press 'Create'. I've created a few groups - Finance & Accounting, Traders, Production Support, and 'Market Data Engineering' in my environment.
From here just go back to the 'vwap_5_minute' dataset and edit your dataset. I've added 'Traders' as the business owner of the dataset and 'Market Data Engineering' as the technical owners.
With all of this done selecting lineage and then the vwap_5_minute dataset gives a much richer experience:
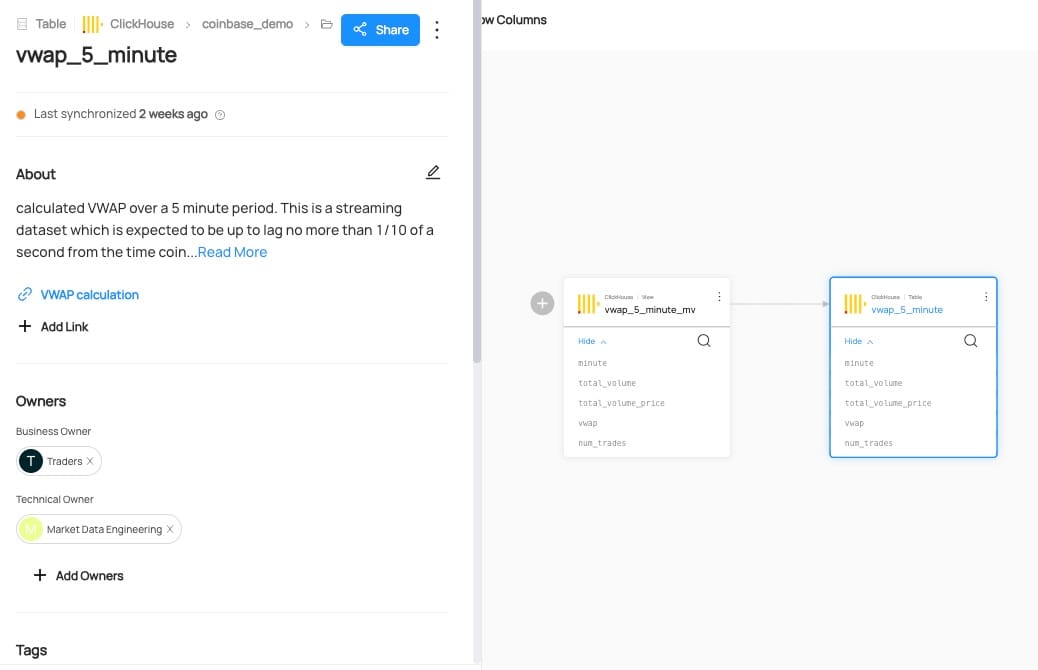
We can now easily find datasets, understand how they were derived, see who owns them, and find documentation, all without needing to even have access to the data itself.
Next Steps
We've now built a remarkably capable data platform with just a few open-source components:
- ClickHouse for storage and computation
- Superset for visualization
- Grafana for Observibility
- DBT for transformation
- DataHub for governance
With these tools in place, you can:
- Ingest batch or streaming data efficiently
- Transform it into useful models
- Create visualizations and dashboards
- Discover existing datasets
- Understand data lineage
- Establish ownership and accountability
- Classify sensitive information
- Implement basic governance processes
The next logical step would be to formalize your data governance program with defined roles (Data Owners, Data Stewards) and processes (Data Quality Management, Change Management). DataHub provides the technical foundation for these more mature governance practices.
Remember the core philosophy we've followed throughout this series: build incrementally, solve real problems, and iterate. Start with the governance capabilities that address your most pressing pain points, then expand as your organization's needs evolve.
Conclusion
When we started this series, we set out to build a simple, maintainable streaming data platform. By adding DataHub, we've now addressed the governance challenges that inevitably arise as data usage grows.
The scenario we opened with—duplicate datasets, inconsistent metrics, and confusion about data definitions—is all too common. But with proper governance through DataHub, we can avoid these pitfalls and ensure that our data platform delivers consistent, trustworthy insights.
We've done this all with open-source tools that can be deployed quickly and scaled as needed. Whether you're just starting your data journey or looking to bring order to an existing data ecosystem, this approach provides a solid foundation that can grow with your organization.
Have you implemented a data platform in your organization? I'd love to hear about your stack and approach in the comments below.
If you are on this journey and would like to talk to someone who has been there, I'd love to hear from you.